
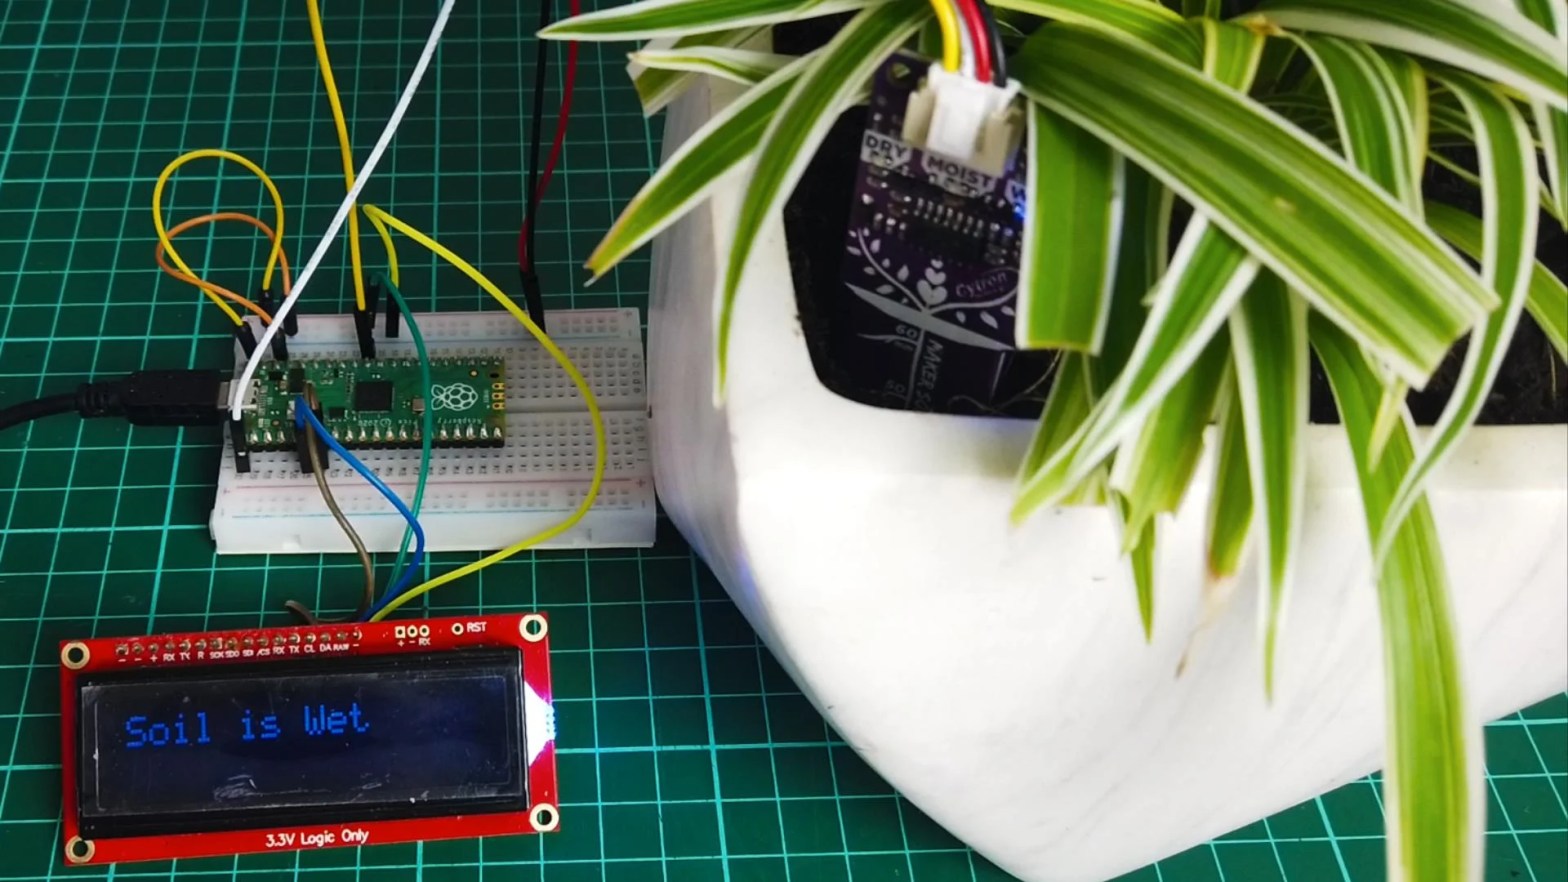
A Beginner Project for Teens
In one afternoon, you can build a sensor that tells you exactly when your plants need water, and prints it to your screen every few seconds.
At Climate Roots, we grow food in community gardens and a student-built greenhouse. One lesson keeps coming up: plants don’t die from lack of care, they die from guessing. Too much water drowns roots. Too little and your lettuce wilts before harvest. A soil moisture monitor replaces guessing with data.
This project is built for beginners. If you can plug in a USB cable and copy a line of code, you can do this. By the end, you will have:
- A working soil moisture sensor wired to a Raspberry Pi
- A Python program that reads moisture as a percentage (0% dry, 100% wet)
- An alert that tells you when it’s time to water
- A log file you can graph to see how your soil dries out over time
Time: 1 to 2 hours.
Cost: about $15 in parts if you already have a Pi.
Skill level: beginner.
What you’ll need
Any Raspberry Pi with the 40-pin header works (Pi 3, 4, 5, or Zero 2 W). Prices are typical US retail and will vary.
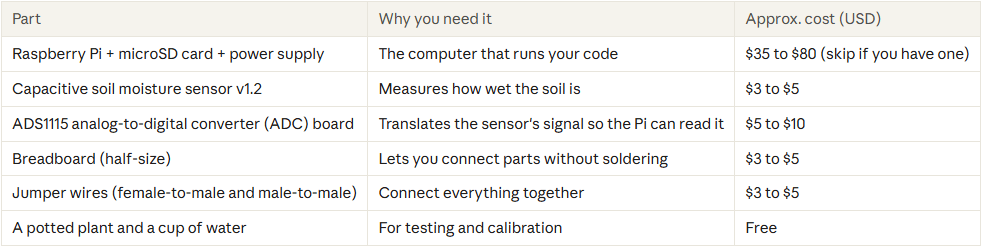
Tip: Buy a capacitive sensor, not the cheap two-prong resistive kind. Resistive probes pass current through the soil and corrode within weeks. Capacitive sensors are sealed and last much longer.
Some ADS1115 boards arrive with loose header pins. If yours does, ask a mentor or teacher to help you solder them on. It’s a great first soldering job.
How it works
The sensor sends out a voltage that drops as the soil gets wetter. Water changes how electricity behaves around the sensor’s sealed probe (its capacitance), and the sensor turns that into a voltage between roughly 1 and 3 volts.
Here’s the catch: the Raspberry Pi can only read digital signals, meaning on or off. It has no built-in way to read a voltage in between. That’s why we add the ADS1115. It measures the voltage and sends the Pi a number over a two-wire connection called I2C.
So the data flows like this:
Soil--> Sensor(voltage)--> ADS115(number)--> RPi(Python)--> Your screen
One important detail: this sensor reads higher when dry and lower when wet. It feels backwards at first. Our code flips it so 100% means soaked.
Step-by-step build
Step 1: Set up your Pi and turn on I2C
Start with Raspberry Pi OS installed and your Pi connected to a screen or reachable over SSH. Open a terminal and run:
sudo apt updatesudo apt install -y i2c-tools python3-venvsudo raspi-config nonint do_i2c 0sudo reboot
Step 2: Wire it up
Unplug the Pi’s power before wiring. Connecting wires to a powered board is the fastest way to fry something.
Place the ADS1115 on the breadboard, then make these connections. Pin numbers are the physical pin numbers on the Pi’s 40-pin header (pin 1 sits on a square solder pad; type pinout in the terminal to see a map of your board)
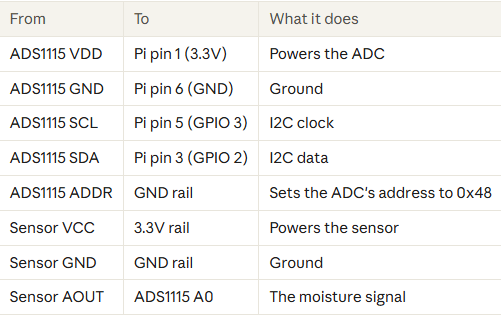
Use the breadboard’s power rails to share 3.3V and GND between the ADC and the sensor. We power everything from 3.3V (not 5V) so the signal stays in a safe range for the Pi.
Step 3: Check that the Pi can see the ADC
Power the Pi back on and run:
i2cdetect -y 1
You should see 48 in the grid. That’s your ADS1115 saying hello.
Step 4: Install the Python library
We’ll keep the project in its own folder with its own virtual environment, a private box for this project’s Python packages:
mkdir ~/soil-monitorcd ~/soil-monitorpython3 -m venv .venvsource .venv/bin/activatepip install adafruit-blinka adafruit-circuitpython-ads1x15
You’ll see (.venv) at the start of your terminal line. That means the environment is active. Run source .venv/bin/activate again any time you open a new terminal.
Step 5: Take your first reading
Create a file called test.py and paste this in:
import timeimport boardfrom adafruit_ads1x15 import ADS1115, AnalogIn, ads1x15i2c = board.I2C()ads = ADS1115(i2c)sensor = AnalogIn(ads, ads1x15.Pin.A0)while True: print(f"raw: {sensor.value:6d} voltage: {sensor.voltage:.3f} V") time.sleep(1)
Run it with python test.py. Numbers should scroll by once per second. Press Ctrl+C to stop.
Step 6: Calibrate your sensor
Every sensor is slightly different, so you need to teach your code what “dry” and “wet” look like for yours. Run test.py again and record two voltages:
- Dry: hold the sensor in the air (or push it into bone-dry soil). Write down the voltage.
- Wet: dip the sensor into a cup of water. Write down the voltage.
Only dip the probe up to the white line printed on it. The electronics at the top must stay dry.
Your numbers might look something like 2.50 V dry and 1.20 V wet. Yours will differ, and that’s fine. That’s the whole point of calibrating.
Step 7: Write the monitor program
Create soil_monitor.py and paste in the code below. Change DRY_VOLTAGE and WET_VOLTAGE to your numbers from Step 6.
"""Soil moisture monitor.Reads a capacitive soil sensor through an ADS1115 ADC,prints moisture as a percentage, and logs every reading to a CSV file."""import csvimport timefrom datetime import datetimefrom pathlib import Pathimport boardfrom adafruit_ads1x15 import ADS1115, AnalogIn, ads1x15# ---- Settings: put YOUR calibration numbers here ----DRY_VOLTAGE = 2.50 # sensor in dry air or bone-dry soilWET_VOLTAGE = 1.20 # sensor in water (up to the line) or soaked soilWATER_BELOW = 35 # show an alert when moisture drops below this %READ_EVERY = 10 # seconds between readingsLOG_FILE = Path("moisture_log.csv")# -----------------------------------------------------i2c = board.I2C()ads = ADS1115(i2c)sensor = AnalogIn(ads, ads1x15.Pin.A0)def read_voltage(samples=10): """Average several quick readings to smooth out noise.""" total = 0.0 for _ in range(samples): total += sensor.voltage time.sleep(0.05) return total / samplesdef to_percent(voltage): """Turn a voltage into 0-100% moisture (dry = 0, wet = 100).""" percent = (DRY_VOLTAGE - voltage) / (DRY_VOLTAGE - WET_VOLTAGE) * 100 return max(0, min(100, round(percent)))def log_reading(timestamp, voltage, percent): """Add one row to the CSV log, writing a header the first time.""" new_file = not LOG_FILE.exists() with LOG_FILE.open("a", newline="") as f: writer = csv.writer(f) if new_file: writer.writerow(["timestamp", "voltage", "moisture_percent"]) writer.writerow([timestamp, f"{voltage:.3f}", percent])def main(): print("Soil monitor running. Press Ctrl+C to stop.") while True: voltage = read_voltage() percent = to_percent(voltage) now = datetime.now().strftime("%Y-%m-%d %H:%M:%S") status = "Time to water!" if percent < WATER_BELOW else "Soil looks good." bar = "#" * (percent // 5) print(f"{now} {percent:3d}% [{bar:<20}] {status}") log_reading(now, voltage, percent) time.sleep(READ_EVERY)if __name__ == "__main__": try: main() except KeyboardInterrupt: print("\nStopped. Your data is saved in", LOG_FILE)
What each part does:
- Settings hold your calibration numbers and alert level, all in one place so they’re easy to change.
read_voltage()takes 10 quick readings and averages them. Single readings jump around a little; averaging smooths that out.to_percent()flips and scales the voltage so dry is 0% and wet is 100%. Themax/minkeeps the result between 0 and 100 even if a reading goes past your calibration points.log_reading()saves every reading tomoisture_log.csv, which opens in Google Sheets or Excel.main()loops forever: read, convert, print a little bar graph, save, wait.
Step 8: Plant it and run it
Push the sensor into your plant’s soil, up to the white line, a few centimeters from the stem. Then run:
python soil_monitor.py
You’ll see output like this:
2026-04-25 14:02:10 62% [############ ] Soil looks good.2026-04-25 14:02:20 61% [############ ] Soil looks good.
Test it: water the plant and watch the number climb.
Want it to start automatically when the Pi turns on? Run crontab -e and add this line at the bottom:
@reboot sleep 30 && cd ~/soil-monitor && .venv/bin/python soil_monitor.py >> monitor.out 2>&1
Now the Pi logs moisture day and night, even without a screen attached.
Level up
Once your monitor works, here’s where to take it next. Each idea builds on the code you already wrote.
- Graph your data. Open
moisture_log.csvin Google Sheets and make a line chart. You’ll see how fast your soil dries on hot days versus cool ones. - Add more plants. The ADS1115 has four inputs (A0 to A3). Wire three more sensors and track a whole garden bed.
- Add a light. Connect an LED to a GPIO pin and turn it on when it’s time to water.
- Automate watering. Add a relay and a small pump so the Pi waters the plant itself. This is exactly the kind of system our greenhouse team builds.
- Enter a competition. Turn your monitor into a project for a Climate Roots youth competition. Judges love real data from real gardens.
Grow with us
This project is a small version of what Climate Roots students do every week: combining sustainable food gardening with robotics, automation and data. Want to build bigger things with a team? Get involved or check out our programs.
As always, keep calm and keep growing!

